

Python Data Analysis Project - C02 Emission
A Carbon Emission Tracker with tools like Graph Plotter, CSV Subset Exports and Country-wise comparison. Prime example of data wrangling and cleaning.


Python Data Science Project
In this project, we will design Python Application for Data Analysis. The purpose is to discover the Maximum and Minimum emission in Country + Average emission in a year. Creating a Data Analysis Application, all at once may seem a herculean task, and hence this project is divided into six modules.
To begin with the project, you'll need a Carbon Emission by Years and Countries (CSV File) which can be downloaded from the Github Repository of this Project
Name: Python Data Analysis
Purpose: Maximum and Minimum emission in Country + Average emission in year

Algorithm:

Step 1: Take the input from user
Step 2: Extracting index of the year
Step 3: Creating the list of emission in year
Step 4: Performing the analysis
Step 5: Printing the data in required format using formatted string
DAY 1
Today we start with the first module – Read CSV File and store data in the dictionary
The goal of today's task is to get the following output:-
It may look scary, but it's not that difficult. The screen consists of following
- Read CSV File and store data in the dictionary.
- Each key in the dictionary should be a string, as read from the CSV file. The value of that key will be a Python list.
- You will use this dictionary for the next three modules.
At this stage, your goal is to simply read file. The challenge is you can’t use any python library like pandas.
Solution
import matplotlib.pyplot as plt

try:
    print("A Simple Data Analysis Program")
    print()

    emission_dict = {}

    with open('Emissions.csv', 'r') as file:
        for data in file.read().split('\n'):
            emission_dict.update({data.split(',')[0]: data.split(',')[1:]})

    print("All data from Emissions.csv has been read into a dictionary.", end='\n\n')
DAY 2
It's time to start the data analysis. The simple assignment today is to
- Take input from the user
- Calculate worldwide statistics (min, max, average) for a user-entered year
The goal of today's task is to get the following output:-

Solution
  """
  Step 1: Take the input from user
  """

    '''TODO: input_year = input('Enter the year for which you'd like to see the data: ')'''
    input_year = '2001'

    index_of = None
    lines = []
  """
  Step 2: Extracting index of the year
  """
    # Loop through First VALUE of Dictionary and if year present in list then set index of VALUE as index_of
    for item in emission_dict.values():
        if input_year in item:
            index_of = (item.index(input_year))

    total = 0
    i = 0
    emissions_in_year = []
  """
  Step 3: Creating the list of emission in year
  """
    # Loop through VALUES of Dictionary
    for value in emission_dict.values():
        # For the first loop skip the code because in our case it contains Column Names and Years
        if i != 0:
            # Add VALUE of Emission to total
            total += float(value[index_of])
            # Append the value to emissions_in_year
            emissions_in_year.append(list(emission_dict.values())[i][index_of])
        i += 1

  """
  Step 4: Performing the analysis
  """
    # Let's try to understand this from inner Single Line loop. We converted String to float and created list, from this
    # list we found the maximum and minimum float value, converted that into string and got the index of maximum and
    # minimum emission country.
    max_country_index = int(emissions_in_year.index(
        str(max(float(str_value) for str_value in emissions_in_year))))
    min_country_index = int(emissions_in_year.index(
        str(min(float(str_value) for str_value in emissions_in_year))))
    average_emissions = total / len(emission_dict.values())

    # Using index value we got the Name of maximum and minimum country name
    max_emission = list(emission_dict.keys())[max_country_index + 1]
    min_emission = list(emission_dict.keys())[min_country_index + 1]

  """
  Step 5: Printing the data in required format using formatted string
  """
    print(f'In {input_year}, countries with minimum and maximum CO2 emission levels were: [{min_emission}] '
          f'and [{max_emission}] respectively.')
    print(
        f'Average CO2 emissions in {input_year} were {"%.6f" % round(average_emissions, 6)}')
    print()
DAY 3
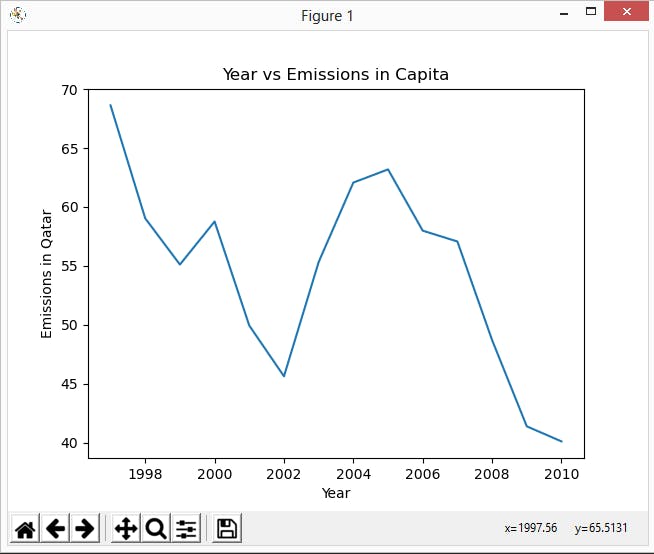
Plot the emissions data from a user-selected country
It's time to visualize the data. Plot the emissions data from a user-selected country. You should use Python plotting library matplotlib for drawing the plots. The below should be your output.
Solution
"""
Step 6: Take the input from user to visualize data
"""
    ''' TODO: visualize_country = input('Enter the country for which you'd like to visualize the data)
        TODO: Exception Handling
    '''
    visualize_country = 'Qatar'

  """
  Step 7: Getting the index of Country and passing it to plot function, Setting the Title and Label of Plot
  """

    # From user entered value we extracted the Index value of country
    number = list(emission_dict.keys()).index(visualize_country)
    # Passed that index value to matplotlib plot function. As x value we passed years and as y value we passed emission value
    plt.plot(list(map(float, list(emission_dict.values())[0])),
             list(map(float, list(emission_dict.values())[number])))
    # Given the Title and Lable to Plot
    plt.title("Year vs Emissions in Capita")
    plt.xlabel("Year")
    plt.ylabel("Emissions in " + visualize_country.title())
    plt.show()
    print()
DAY 4
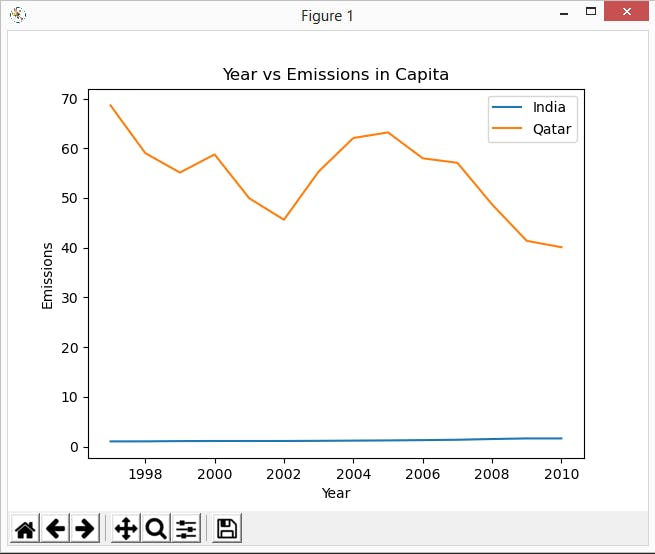
It's time to compare data. In today's task, you will plot a comparison graph based on user input.
Using the Matplotlib library, plot two graphs with distinct colours and legend so see the trend.
Solution
 """
  Step 8: Take two comma-separated countries input from user
 """
    '''TODO:country1, country2 = input("Write two comma-separated countries for which you want to visualize data: ").split(", ")'''
    country1, country2 = 'India', 'Qatar'
  """
  Step 9: Extracting the Index number for both countries
  """

    index_num_1 = list(emission_dict.keys()).index(country1)
    index_num_2 = list(emission_dict.keys()).index(country2)

  """
  Step 10: Passing the value to plot function and setting up label for country
  """

    # In this task we combined two plots in one and given the label to identify.
    plt.plot(list(map(float, list(emission_dict.values())[0])),
             list(map(float, list(emission_dict.values())[index_num_1])), label=country1)
    plt.plot(list(map(float, list(emission_dict.values())[0])),
             list(map(float, list(emission_dict.values())[index_num_2])), label=country2)
    plt.title("Year vs Emissions in Capita")
    plt.xlabel("Year")
    plt.ylabel("Emissions")
    plt.legend()
    plt.show()
    print()
DAY 5
Export a CSV Subset of Desired countries.
Extract data for up to three user-selected countries and save it to a new file Emissions_subset.csv.
The new file should have the exact same format as the source file, i.e. first line of headers and then up to 3 lines for selected countries.

Solution
"""
Step 11: Creating function that will take one list input - Check for maximum three countries and write to Emissions_subset.csv file
"""
    def extract_data(country):
        list_len = len(country)
        for length in range(0, list_len):
            # Validating input up to three countries - If there are more then three countries then return false
            if list_len > 3:
                print("ERR: Sorry, at most 3 countries can be entered.", end="\n\n")
                return False
        else:
            # Creating string to write in CSV File
            write_line_csv = list(emission_dict.keys())[0].title(
            ) + "," + ",".join(list(emission_dict.values())[0]) + "\n"
            for num in range(0, len(country)):
                write_line_csv += country[num].title() + "," + ",".join(
                    emission_dict[country[num]]) + "\n"
            # Open CSV in write mode and writing lines to CSV
            with open('Emissions_subset.csv', 'w') as new_file:
                new_file.writelines(write_line_csv)
            # Printing the value in required format
            print(f"Data successfully extracted for countries " + ", ".join(
                country).title() + " saved into file Emissions_subset.csv", end="\n\n")
        return True

    print("A Simple Data Analysis Program")
    print()

  """
  Step 12: Take input up to three comma-separated countries and creating list of countries (Passing value to our function)
  """

    while True:
        '''TODO: input_string = input("Write up to three comma-separated countries for which you want to extract data: ")'''
        input_string = 'India, Oman, Qatar'
        input_country = input_string.split(", ")
        # Calling the Function to validate input
        if not extract_data(input_country):
            continue
        else:
            break

except FileNotFoundError:
    print("File not found....")
except IOError:
    print("Output file can’t be saved")
DAY 6
Exception Handling, Debugging and Testing
Time to handle exceptions and inputs entered by user. Read all the errors and try to make your code more stable that it doesn’t crash. As a part of community exercise, I'll leave that up to you. If you manage to make some cool changes to the project, please send me a PR at my Github Data-Science Repository